If you are running Google Ads / PPC campaign or planning to run a campaign for your company or a client, you must have industry benchmarks to measure the campaign\’s performance.
Industry benchmarks are really important to forecast your Google Ads / PPC campaigns if you are planning a media plan for your company or a client in terms of Average CTR, Average Cost Per Click, Average Conversion Rate and Average Cost Per Action/Acquisition.
Find out the most important Google Ads / AdWords industry benchmarks for your campaign. This will help you in optimizing your campaigns.
Average CTR ( Click-Through Rate ) in Google Ads by industry (Search and Display)

| Industry | Average CTR (Search) | Average CTR (GDN) |
|---|---|---|
| Advocacy | 4.41% | 0.59% |
| Auto | 4.00% | 0.60% |
| B2B | 2.41% | 0.46% |
| Consumer Services | 2.41% | 0.51% |
| Dating & Personals | 6.05% | 0.72% |
| E-Commerce | 2.69% | 0.51% |
| Education | 3.78% | 0.53% |
| Employment Services | 2.42% | 0.59% |
| Finance & Insurance | 2.91% | 0.52% |
| Health & Medical | 3.27% | 0.59% |
| Home Goods | 2.44% | 0.49% |
| Industrial Services | 2.61% | 0.50% |
| Legal | 2.93% | 0.59% |
| Real Estate | 3.71% | 1.08% |
| Technology | 2.09% | 0.39% |
| Travel & Hospitality | 4.68% | 0.47% |
Average CPC ( Cost Per Click) in Google Ads by industry (Search and Display)

| Industry | Average CPC (Search) | Average CPC (GDN) |
|---|---|---|
| Advocacy | $1.43 | $0.62 |
| Auto | $2.46 | $0.58 |
| B2B | $3.33 | $0.79 |
| Consumer Services | $6.40 | $0.81 |
| Dating & Personals | $2.78 | $1.49 |
| E-Commerce | $1.16 | $0.45 |
| Education | $2.40 | $0.47 |
| Employment Services | $2.04 | $0.78 |
| Finance & Insurance | $3.44 | $0.86 |
| Health & Medical | $2.62 | $0.63 |
| Home Goods | $2.94 | $0.60 |
| Industrial Services | $2.56 | $0.54 |
| Legal | $6.75 | $0.72 |
| Real Estate | $2.37 | $0.75 |
| Technology | $3.80 | $0.51 |
| Travel & Hospitality | $1.53 | $0.44 |
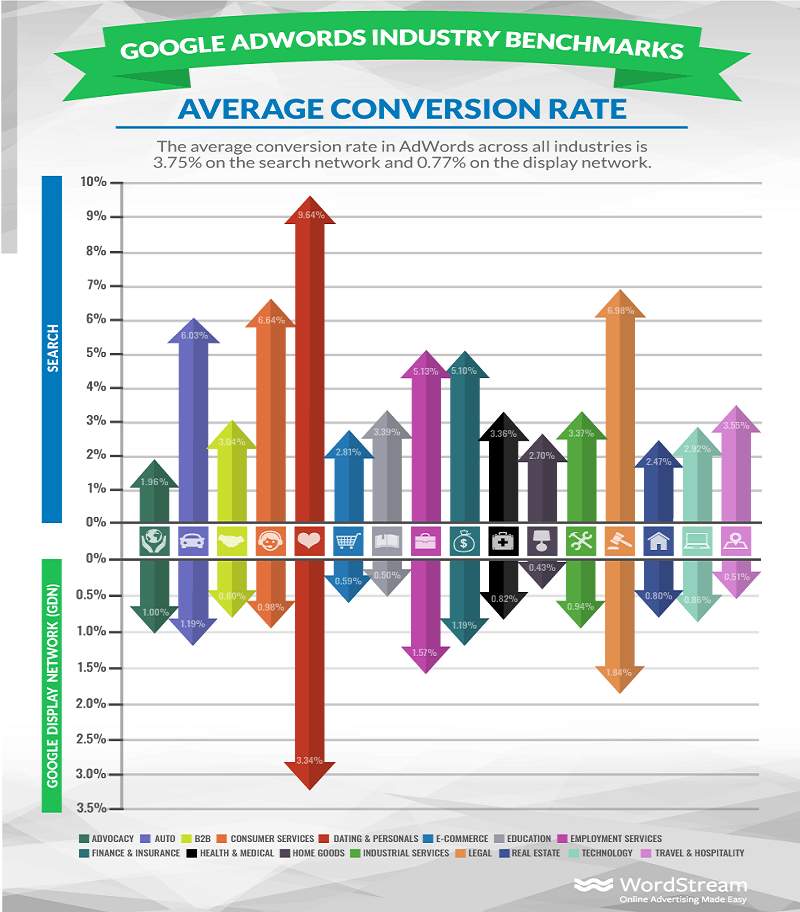
Average CVR ( Average Conversion Rate) in Google Ads by industry (Search and Display)

| Industry | Average CVR (Search) | Average CVR (GDN) |
|---|---|---|
| Advocacy | 1.96% | 1.00% |
| Auto | 6.03% | 1.19% |
| B2B | 3.04% | 0.80% |
| Consumer Services | 6.64% | 0.98% |
| Dating & Personals | 9.64% | 3.34% |
| E-Commerce | 2.81% | 0.59% |
| Education | 3.39% | 0.50% |
| Employment Services | 5.13% | 1.57% |
| Finance & Insurance | 5.10% | 1.19% |
| Health & Medical | 3.36% | 0.82% |
| Home Goods | 2.70% | 0.43% |
| Industrial Services | 3.37% | 0.94% |
| Legal | 6.98% | 1.84% |
| Real Estate | 2.47% | 0.80% |
| Technology | 2.92% | 0.86% |
| Travel & Hospitality | 3.55% | 0.51% |
Average CPA ( Average Cost Per Action) in Google Ads by industry (Search and Display)

| Industry | Average CPA (Search) | Average CPA (GDN) |
|---|---|---|
| Advocacy | $96.55 | $70.69 |
| Auto | $33.52 | $23.68 |
| B2B | $116.13 | $130.36 |
| Consumer Services | $90.70 | $60.48 |
| Dating & Personals | $76.76 | $60.23 |
| E-Commerce | $45.27 | $65.80 |
| Education | $72.70 | $143.36 |
| Employment Services | $48.04 | $59.47 |
| Finance & Insurance | $81.93 | $56.76 |
| Health & Medical | $78.09 | $72.58 |
| Home Goods | $87.13 | $116.17 |
| Industrial Services | $79.28 | $51.58 |
| Legal | $86.02 | $39.52 |
| Real Estate | $116.61 | $74.79 |
| Technology | $133.52 | $103.60 |
| Travel & Hospitality | $44.73 | $99.13 |
Source: wordstream.com
What do you think about the industry benchmarks? Does your campaigns are up to the benchmarks in terms of performance?

